library(gdq)
library(dplyr, warn.conflicts = FALSE)
library(tidyr, warn.conflicts = FALSE)
library(ggplot2)
library(kableExtra)

donations <- gdq::gdq_donations |>
  augment_donations()
runs <- gdq::gdq_runs
gdq_donation_totals <-
  donations |>
  group_by(event) |>
  summarize(
    total = sum(amount),
    avg = mean(amount),
    count = n(),
    gdq = unique(gdq),
    year = unique(year),
    .groups = "drop"
  ) |>
  arrange(as.numeric(year)) |>
  mutate(
    cumtot = cumsum(total),
    cummean = cummean(total)
  )
gdq_donation_totals |>
  ggplot(aes(x = year, y = total, fill = gdq)) +
  geom_col(position = position_dodge2(preserve = "single"), alpha = .75) +
  scale_x_year_discrete() +
  scale_y_currency(
    breaks = seq(0, 10e6, 5e5),
    minor_breaks = seq(0, 10e6, 2.5e5)
  ) +
  scale_colorfill_gdq(guide = "none") +
  labs(
    title = "Games Done Quick: Donation Totals",
    subtitle = glue::glue(
      "Donation totals for <span style='color:{gdq_pal[['AGDQ']]}'>AGDQ</span> and <span style='color:{gdq_pal[['SGDQ']]}'>SGDQ</span> as per the official tracker page"
    )
  ) +
  theme_gdq()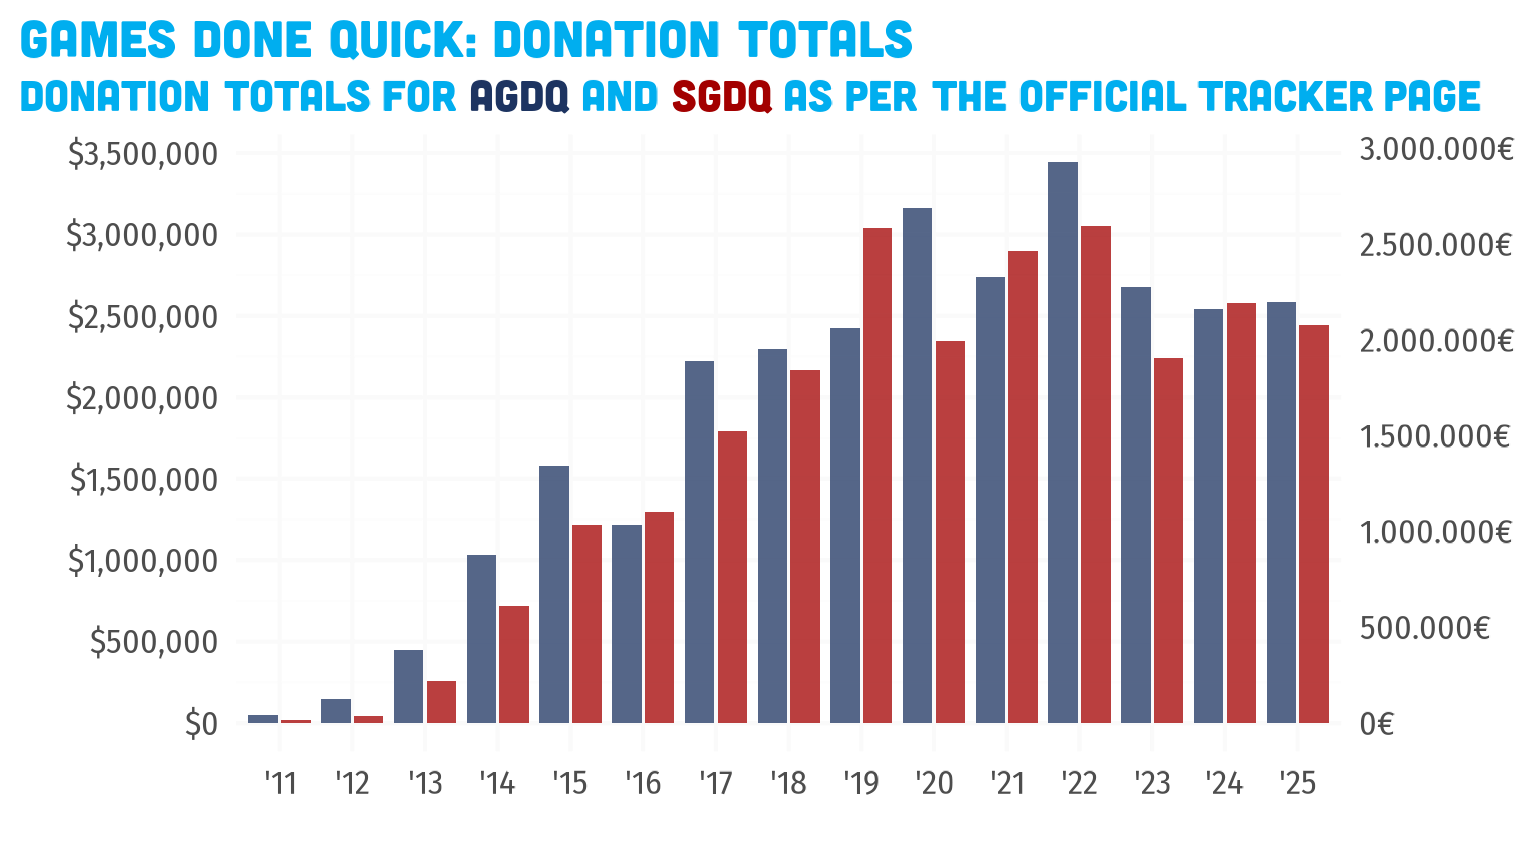
Relative to Average
gdq_donation_totals |>
  ggplot(aes(x = as.integer(year), y = cumtot, color = gdq, fill = gdq)) +
  scale_x_year() +
  scale_y_currency() +
  scale_colorfill_gdq(guide = "none") +
  geom_line(linewidth = 1.15) +
  geom_point(shape = 21, size = 3, color = "white", stroke = 1.5) +
  labs(
    title = "Games Done Quick: Cumulative Donation Totals",
    subtitle = glue::glue(
      "Donation totals for <span style='color:{gdq_pal[['AGDQ']]}'>AGDQ</span> and <span style='color:{gdq_pal[['SGDQ']]}'>SGDQ</span> as per the official tracker page"
    )
  ) +
  theme_gdq()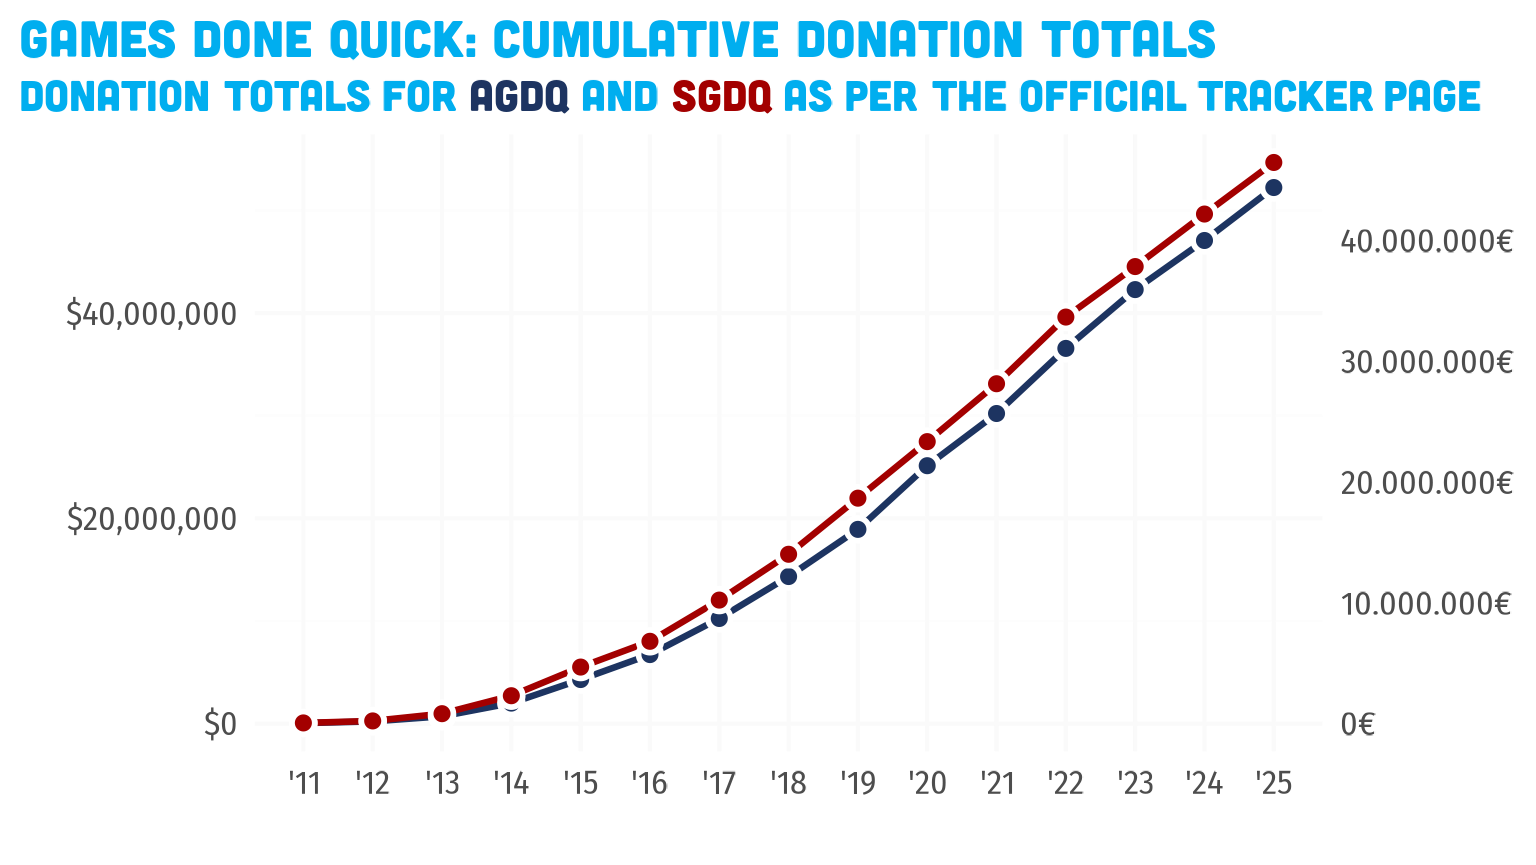
gdq_donation_totals |>
  ggplot(aes(x = as.integer(year), y = total, color = gdq, fill = gdq)) +
  scale_x_year() +
  scale_y_currency() +
  scale_colorfill_gdq(guide = "none") +
  geom_line(linewidth = 1.15) +
  geom_point(shape = 21, size = 3, color = "white", stroke = 1.5) +
  labs(
    title = "Games Done Quick: Donation Totals",
    subtitle = glue::glue(
      "Donation totals for <span style='color:{gdq_pal[['AGDQ']]}'>AGDQ</span> and <span style='color:{gdq_pal[['SGDQ']]}'>SGDQ</span> as per the official tracker page"
    )
  ) +
  theme_gdq()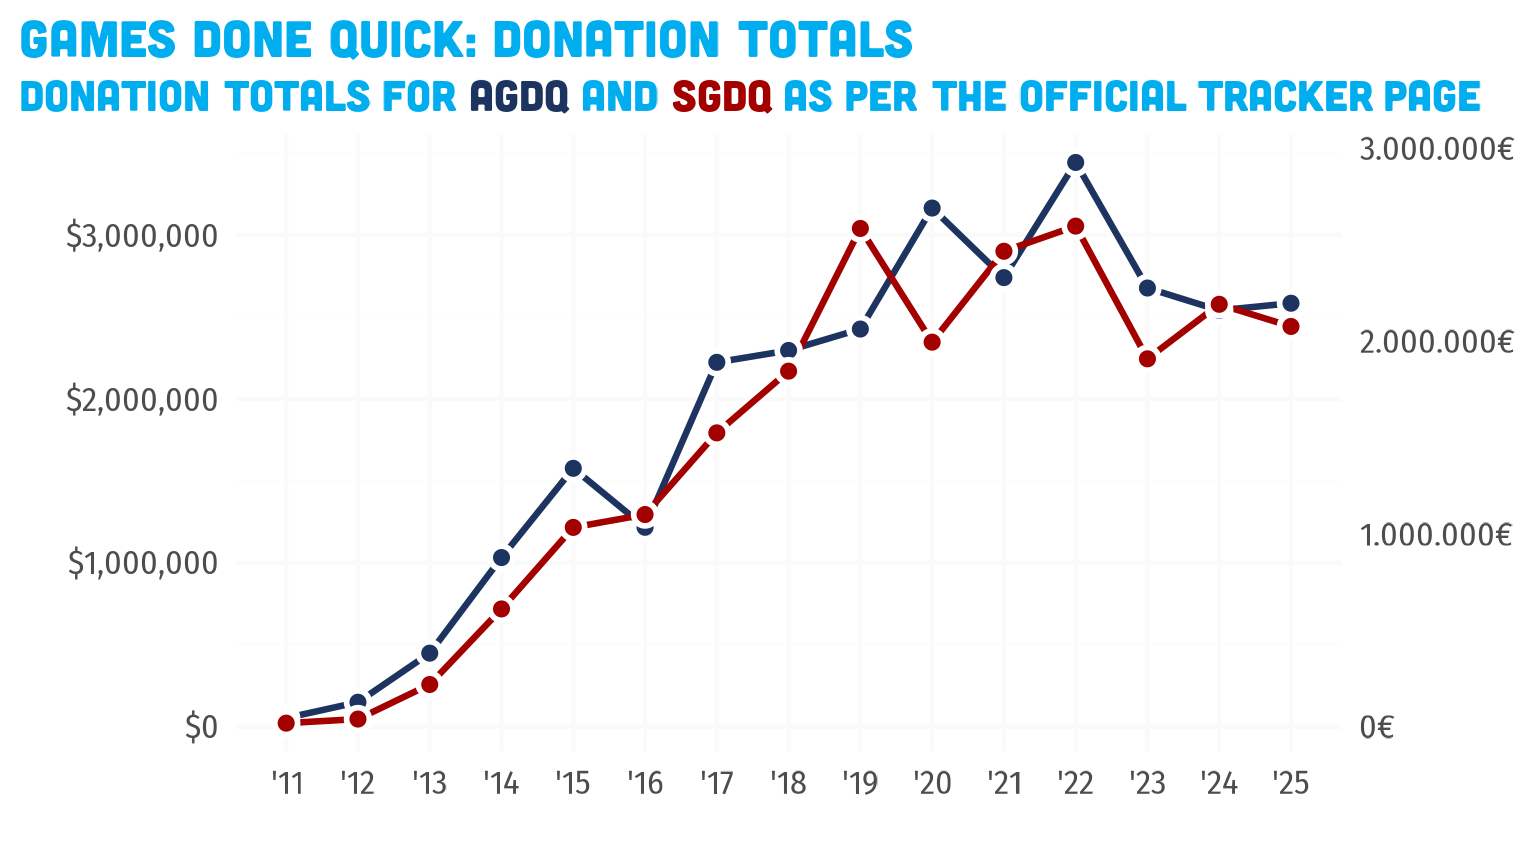
gdq_donation_totals |>
  group_by(gdq) |>
  mutate(lagtotal = total - lag(total, default = 0)) |>
  ggplot(aes(x = as.integer(year), y = lagtotal, color = gdq, fill = gdq)) +
  geom_col(alpha = 5 / 12, position = position_dodge2()) +
  scale_x_year() +
  scale_y_currency() +
  scale_colorfill_gdq(guide = "none") +
  labs(
    title = "Games Done Quick: Donation Delta",
    subtitle = glue::glue(
      "Difference in donation totals for <span style='color:{gdq_pal[['AGDQ']]}'>AGDQ</span> and <span style='color:{gdq_pal[['SGDQ']]}'>SGDQ</span>, e.g. AGDQ2022 - AGDQ2021"
    )
  ) +
  theme_gdq()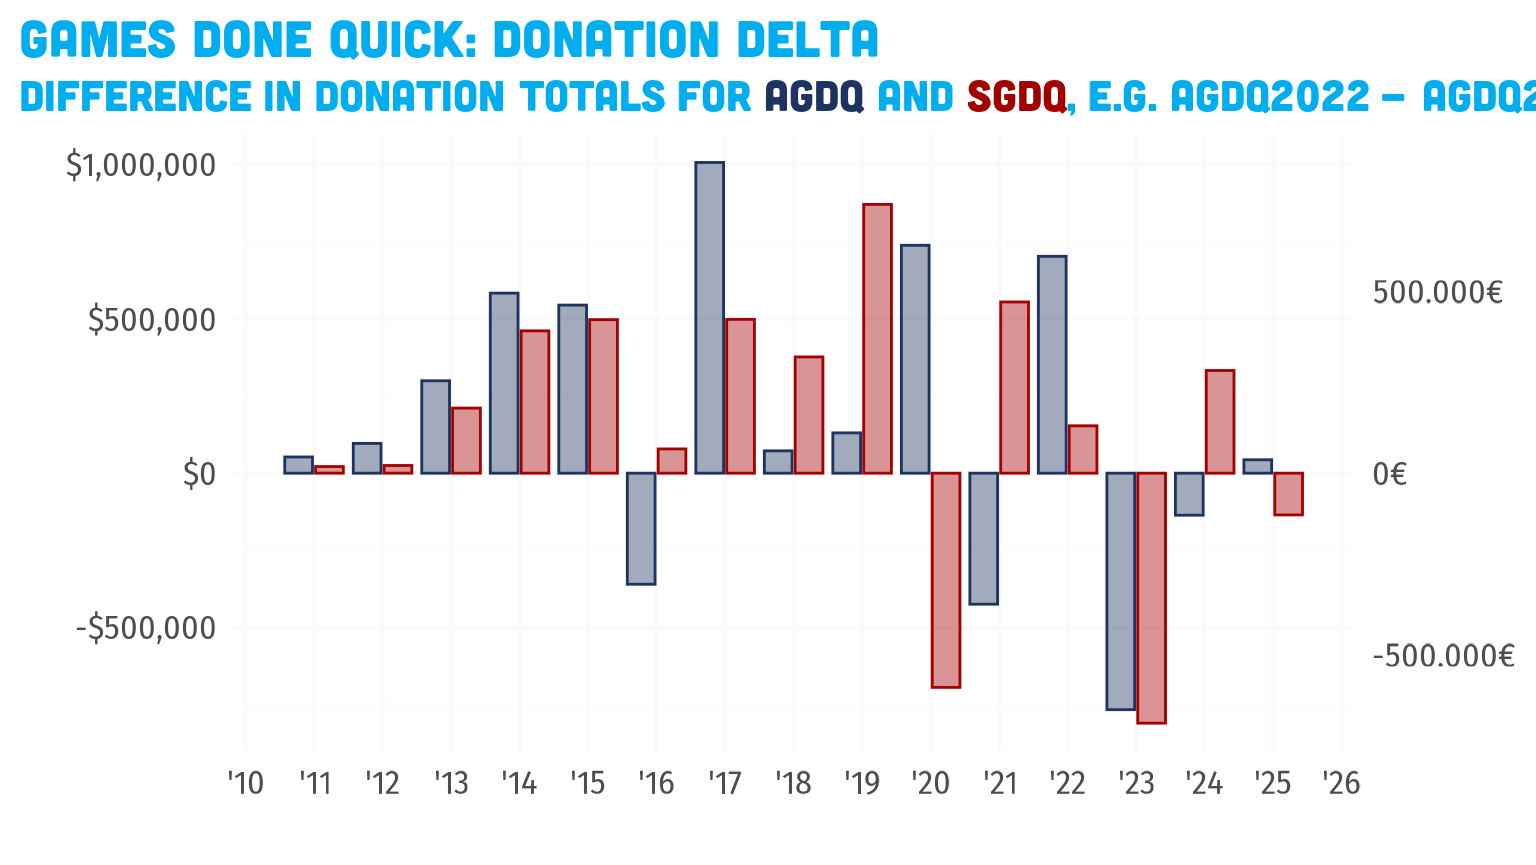
Relative Progress
Unfortunately finding the proper “end time” is not that easy, since
the end time of the last run (or finale section) typically comes way
before the last of the donations have trickled in.
Also, the last “run” listed on the runs page is sometimes the finale,
sometimes the last game, sometimes an explicit total:?
full_join(
  runs |>
    group_by(event) |>
    slice_tail(n = 1) |>
    select(event, run, run_end),
  donations |>
    group_by(event) |>
    slice_tail(n = 1) |>
    select(event, amount, donation_time = time),
  by = "event"
) |>
  arrange(donation_time) |>
  mutate(
    hours_since_end = (run_end %--% donation_time) / lubridate::dhours(1)
  ) |>
  select(
    event,
    last_run = run,
    last_run_end = run_end,
    last_donation = donation_time,
    amount,
    hours_since_end
  ) |>
  kable() |>
kable_styling()| event | last_run | last_run_end | last_donation | amount | hours_since_end |
|---|---|---|---|---|---|
| AGDQ2011 | NA | NA | 2011-01-17 20:27:17 | 0.80 | NA |
| SGDQ2011 | kingdom hearts 2 | NA | 2011-08-14 05:18:36 | 5.00 | NA |
| AGDQ2012 | final fantasy vii part 2 | NA | 2012-01-16 21:35:17 | 363.99 | NA |
| SGDQ2012 | bonus games | NA | 2012-05-30 04:40:46 | 1.00 | NA |
| AGDQ2013 | Bonus Games | NA | 2013-01-23 14:28:05 | 2000.00 | NA |
| SGDQ2013 | notes: | NA | 2013-08-14 14:33:29 | 1500.00 | NA |
| AGDQ2014 | bonus stream | NA | 2014-03-24 19:46:02 | 5.00 | NA |
| SGDQ2014 | Bonus Stream | NA | 2014-07-25 06:26:44 | 15.00 | NA |
| AGDQ2015 | Finale! | NA | 2015-01-15 21:14:47 | 50.00 | NA |
| SGDQ2015 | Finale! | NA | 2015-08-05 00:37:21 | 10.00 | NA |
| AGDQ2016 | Final Fantasy IV Any% no 64 floor glitch | NA | 2016-05-10 05:16:19 | 5.00 | NA |
| SGDQ2016 | Super Mario 64 70 Star Encore 70 star | NA | 2016-07-18 21:45:31 | 35.00 | NA |
| AGDQ2017 | Undertale True Pacifist Ending | NA | 2017-02-03 02:30:16 | 6.00 | NA |
| SGDQ2017 | Earthbound Any% Glitchless | NA | 2017-07-22 20:12:35 | 50.00 | NA |
| AGDQ2018 | The Legend of Zelda: Breath of the Wild All Main Quests (No Amiibo) | NA | 2018-03-26 18:53:24 | 10.00 | NA |
| SGDQ2018 | FINALE post-GDQ blues | NA | 2018-10-28 02:41:36 | 25.00 | NA |
| AGDQ2019 | Finale! 100% | NA | 2019-02-16 22:47:40 | 11.50 | NA |
| SGDQ2019 | Finale The End | NA | 2019-08-27 03:21:43 | 25.00 | NA |
| AGDQ2020 | Finale The End | NA | 2020-01-17 18:21:56 | 25.00 | NA |
| SGDQ2020 | Finale The End | NA | 2020-10-15 16:41:04 | 10825.00 | NA |
| AGDQ2021 | Finale The End | NA | 2021-05-13 21:35:11 | 5.00 | NA |
| SGDQ2021 | Finale The End | NA | 2021-07-11 11:45:15 | 300.00 | NA |
| AGDQ2022 | Finale The End | NA | 2022-01-26 00:02:42 | 10.00 | NA |
| SGDQ2022 | Finale The End | NA | 2022-08-02 19:52:12 | 77.00 | NA |
| AGDQ2023 | Finale The End | NA | 2023-03-03 04:29:07 | 5.00 | NA |
| SGDQ2023 | Finale! The End% | NA | 2023-06-05 14:37:12 | 10.00 | NA |
| AGDQ2024 | Finale! The End% | NA | 2024-01-22 20:02:12 | 16318.00 | NA |
| SGDQ2024 | Finale The End | NA | 2024-07-16 17:15:34 | 678.00 | NA |
| AGDQ2025 | Finale Finale | NA | 2025-01-14 02:12:32 | 18190.00 | NA |
| SGDQ2025 | Summer Games Done Quick 2025 Finale Finale | NA | 2025-07-20 13:17:22 | 25.00 | NA |
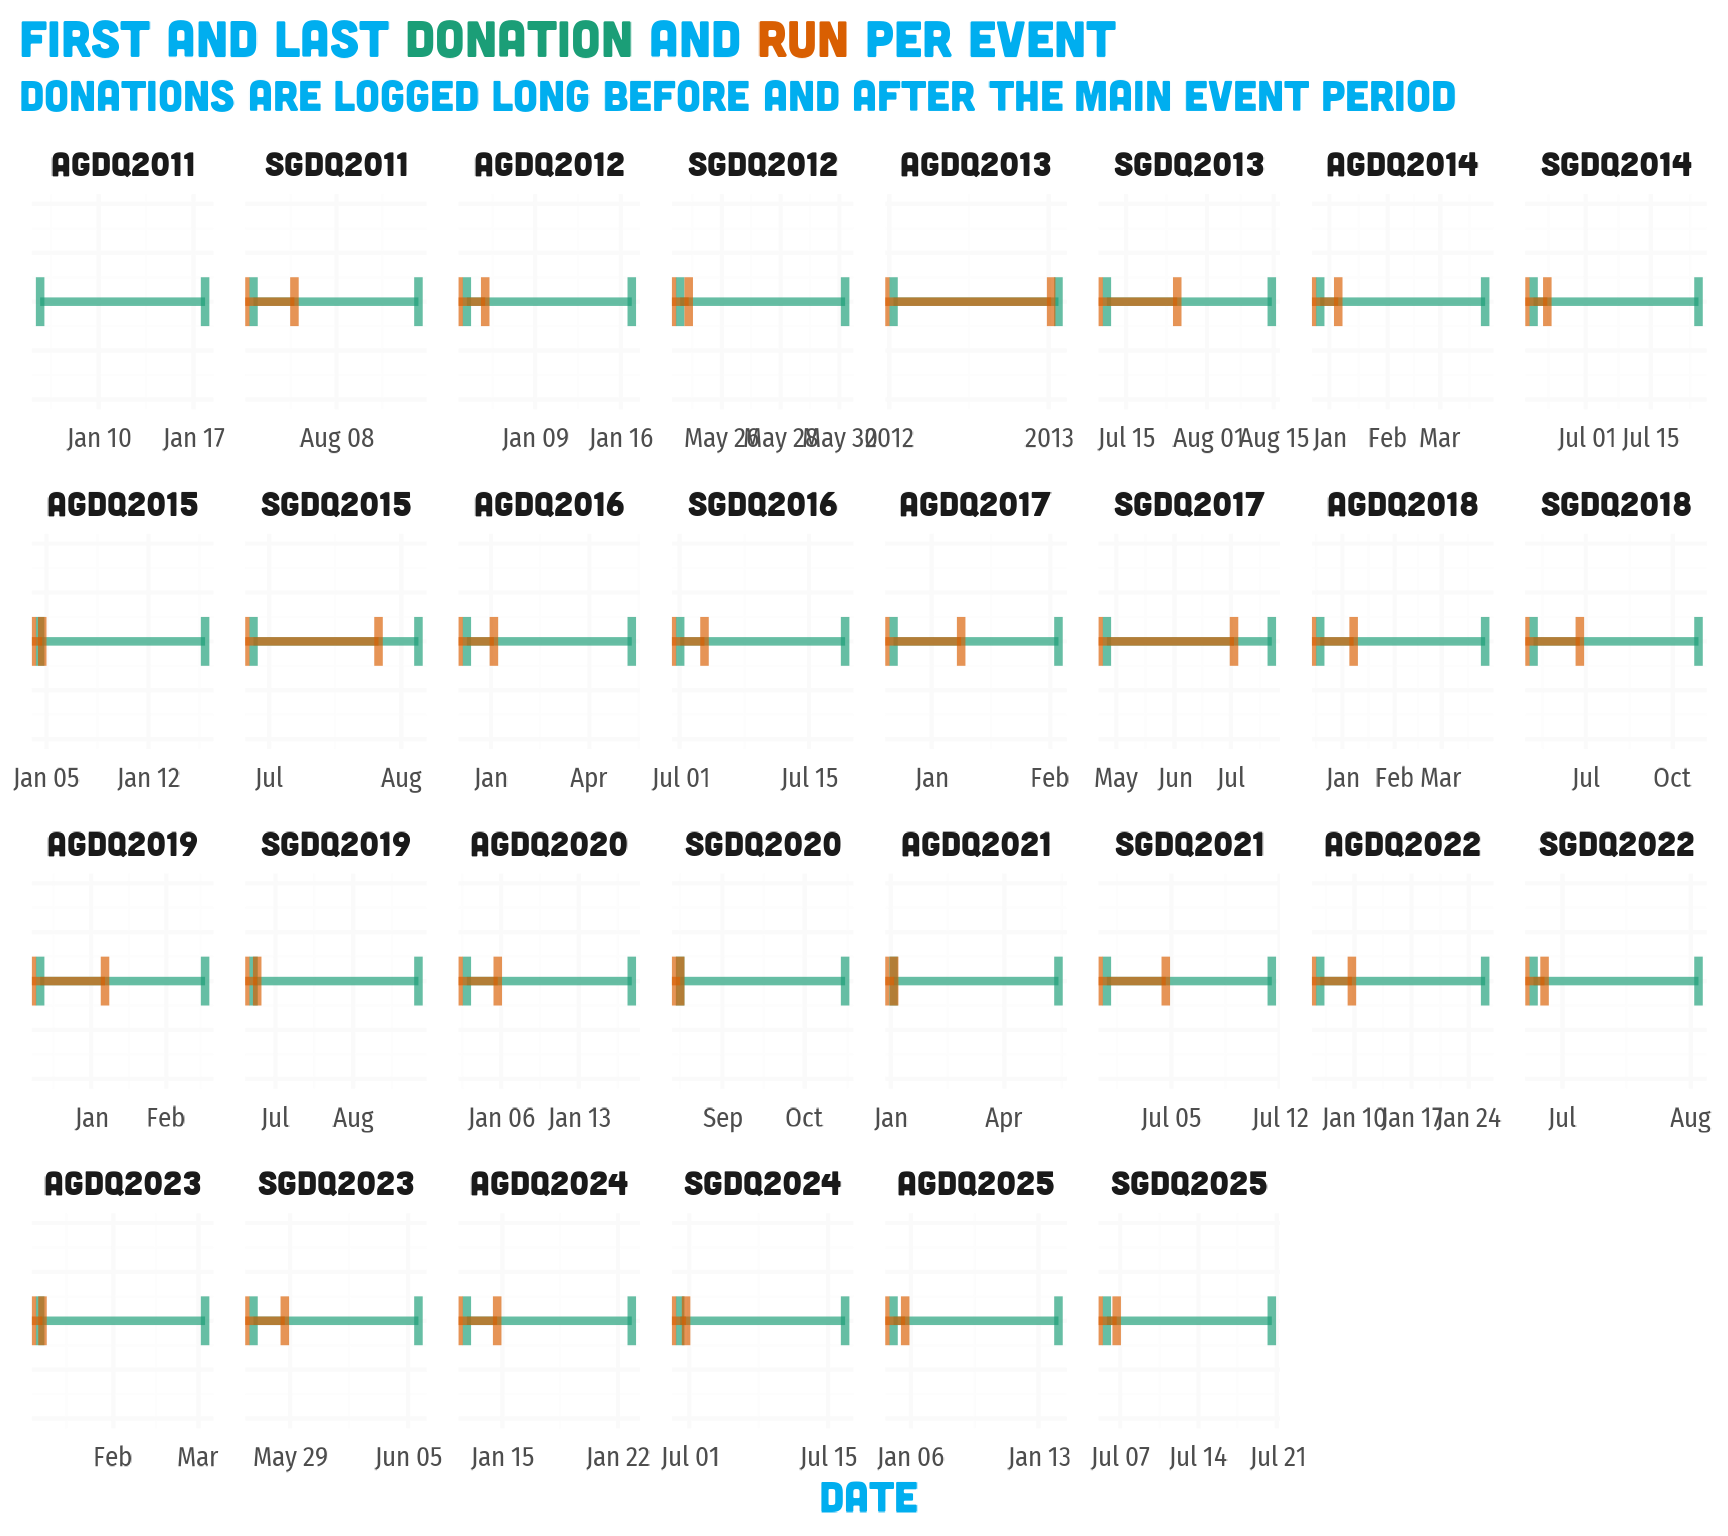
How about we compare first/last donation and first/last run times per event.
bind_rows(
  runs |>
    group_by(event) |>
    summarize(
      type = "run",
      first = min(run_start, na.rm = TRUE),
      last = max(run_end, na.rm = TRUE)
    ),
  donations |>
    group_by(event) |>
    summarize(
      type = "donation",
      first = min(time, na.rm = TRUE),
      last = max(time, na.rm = TRUE)
    )
) |>
  arrange(first) |>
  mutate(
    event = factor(event, levels = event_index$event)
  ) |>
  ggplot(aes(y = 0, xmin = first, xmax = last, fill = type, color = type)) +
  facet_wrap(facets = vars(event), scales = "free", nrow = 4) +
  geom_errorbarh(height = .5, linewidth = 1.5, alpha = 2 / 3) +
  scale_x_datetime(breaks = scales::pretty_breaks(n = 3)) +
  scale_y_continuous(limits = c(-1, 1)) +
  scale_color_brewer(palette = "Dark2", guide = "none") +
  labs(
    title = "First and Last <span style='color:#1B9E77'>Donation</span> and <span style='color:#D95F02'>Run</span>  per Event",
    subtitle = "Donations are logged long before and after the main event period",
    x = "Date"
  ) +
  theme_gdq(
    axis.text.x = element_text(size = rel(.8)),
    axis.line.y = element_blank(),
    axis.text.y = element_blank(),
    axis.title.y = element_blank()
  )
Trying to reasonably determine start and end of the main event period to scale donation progress relatively.
donations |>
  filter(time_rel >= 0 & time_rel <= 1.01) |>
  group_by(event) |>
  mutate(amount_total = cumsum(amount)) |>
  ungroup() |>
  mutate(
    highlight = event == latest_event()
  ) |>
  ggplot(aes(
    x = time_rel,
    y = amount_total,
    color = highlight,
    group = event
  )) +
  geom_step(aes(linewidth = highlight)) +
  scale_x_continuous(labels = scales::percent_format()) +
  scale_y_currency(breaks = scales::pretty_breaks()) +
  scale_color_manual(
    values = c("TRUE" = gdq_pal[["GDQ"]], "FALSE" = "gray"),
    labels = c("TRUE" = latest_event(), "FALSE" = "Previous events"),
    guide = "none"
  ) +
  scale_linewidth_manual(
    values = c("TRUE" = 2, "FALSE" = 1),
    guide = "none"
  ) +
  labs(
    title = "Latest event donation progression",
    subtitle = "Compared to previous events, with time (roughly) relative to start/end of event",
    y = "Cumulative donation total",
    x = "Event Progression"
  ) +
  theme_gdq()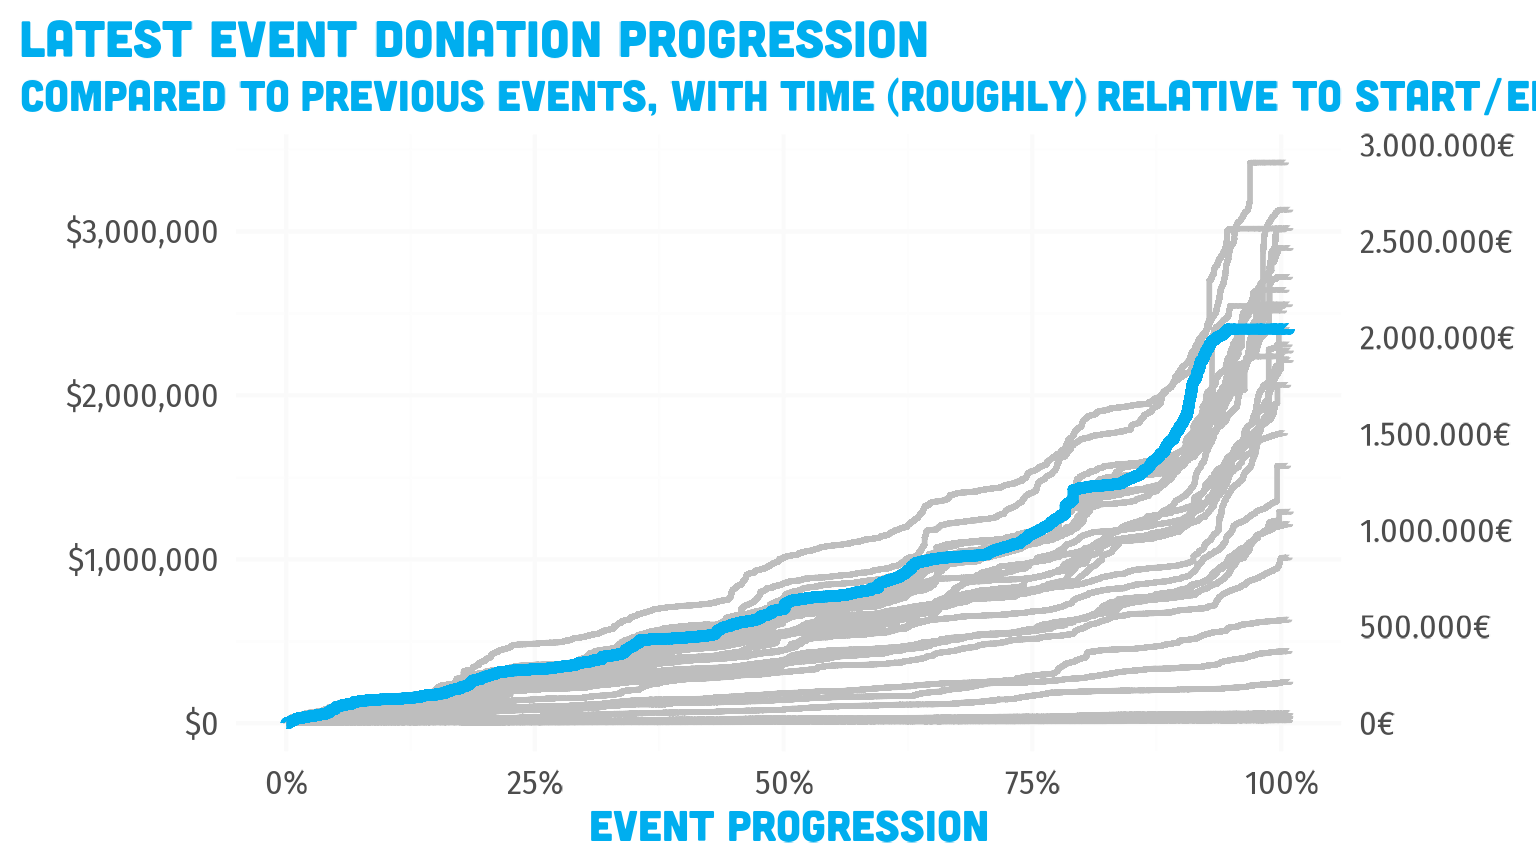
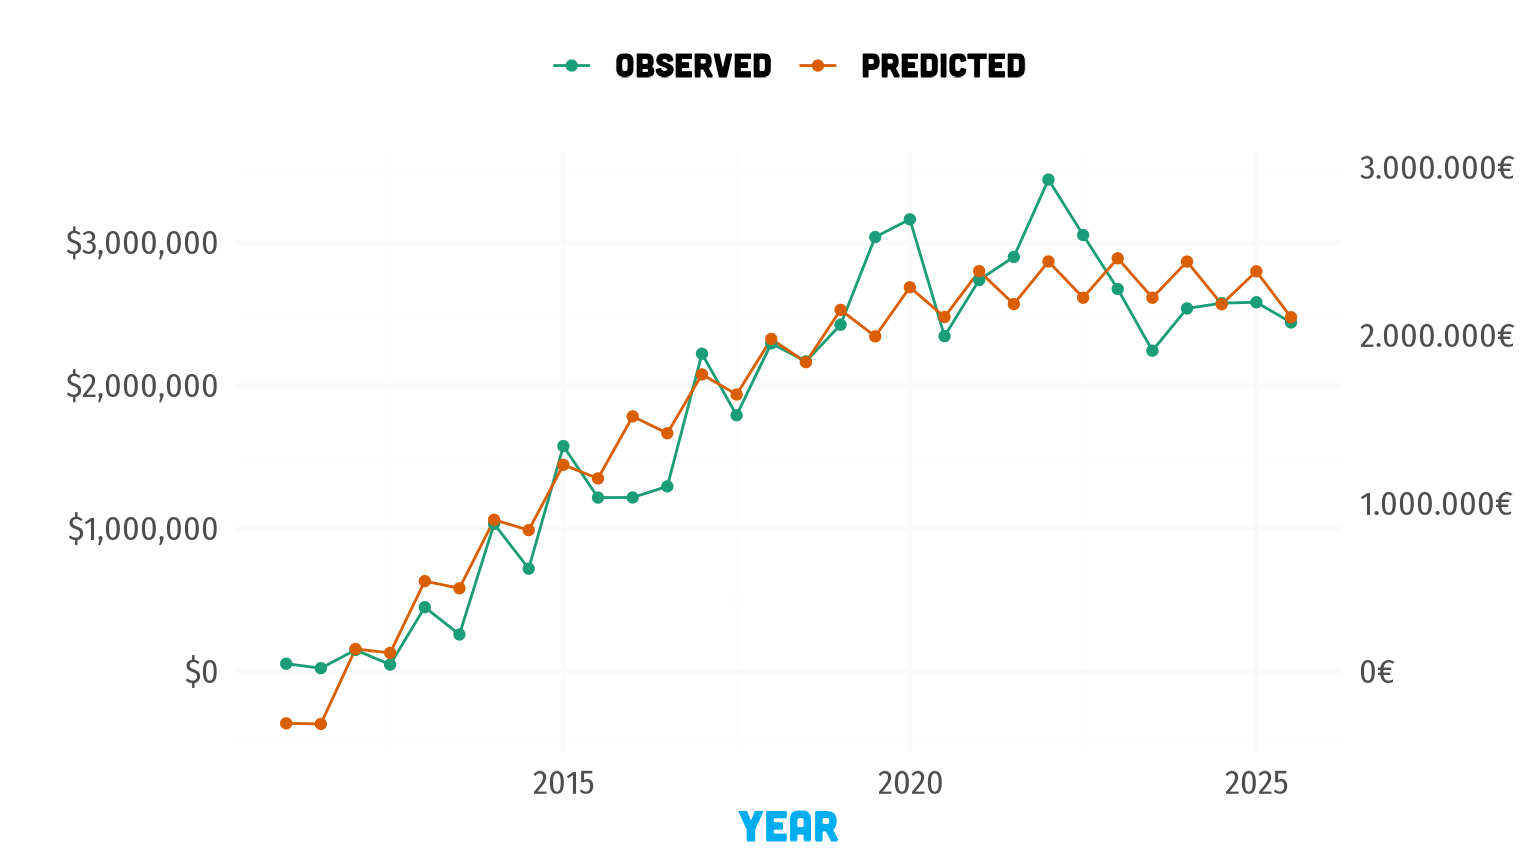
For Fun Model
donation_totals_mod <- gdq_donation_totals |>
  mutate(
    year = as.integer(year),
    year = if_else(gdq == "SGDQ", year + .5, year)
  )

mod <- lm(total ~ gdq + year + I(year^2), data = donation_totals_mod)
broom::glance(mod)
#> # A tibble: 1 × 12
#>   r.squared adj.r.squared   sigma statistic  p.value    df logLik   AIC   BIC
#>       <dbl>         <dbl>   <dbl>     <dbl>    <dbl> <dbl>  <dbl> <dbl> <dbl>
#> 1     0.916         0.906 327945.      93.9 4.47e-14     3  -421.  853.  860.
#> # ℹ 3 more variables: deviance <dbl>, df.residual <int>, nobs <int>

broom::augment(mod) |>
  select(total, gdq, year, .fitted) |>
  left_join(donation_totals_mod, by = join_by(total, gdq, year)) |>
  pivot_longer(
    cols = c(total, .fitted),
    names_to = "type",
    values_to = "total"
  ) |>
  mutate(
    type = case_match(
      type,
      ".fitted" ~ "Predicted",
      "total" ~ "Observed"
    )
  ) |>
  ggplot(aes(x = year, y = total, color = type, fill = type)) +
  geom_line() +
  geom_point() +
  scale_y_currency() +
  scale_color_brewer(
    palette = "Dark2",
    name = NULL,
    aesthetics = c("color", "fill")
  ) +
  labs() +
  theme_gdq()