geom_stepribbon is an extension of the geom_ribbon, and
is optimized for Kaplan-Meier plots with pointwise confidence intervals
or a confidence band.
geom_stepribbon(
  mapping = NULL,
  data = NULL,
  stat = "identity",
  position = "identity",
  na.rm = FALSE,
  show.legend = NA,
  inherit.aes = TRUE,
  ...
)
Arguments
| mapping | Set of aesthetic mappings created by |
|---|---|
| data | The data to be displayed in this layer. There are three options: If A A |
| stat | The statistical transformation to use on the data for this layer, as a string. |
| position | Position adjustment, either as a string, or the result of a call to a position adjustment function. |
| na.rm | If |
| show.legend | logical. Should this layer be included in the legends?
|
| inherit.aes | If |
| ... | Other arguments passed on to |
See also
geom_ribbon geom_stepribbon
inherits from geom_ribbon.
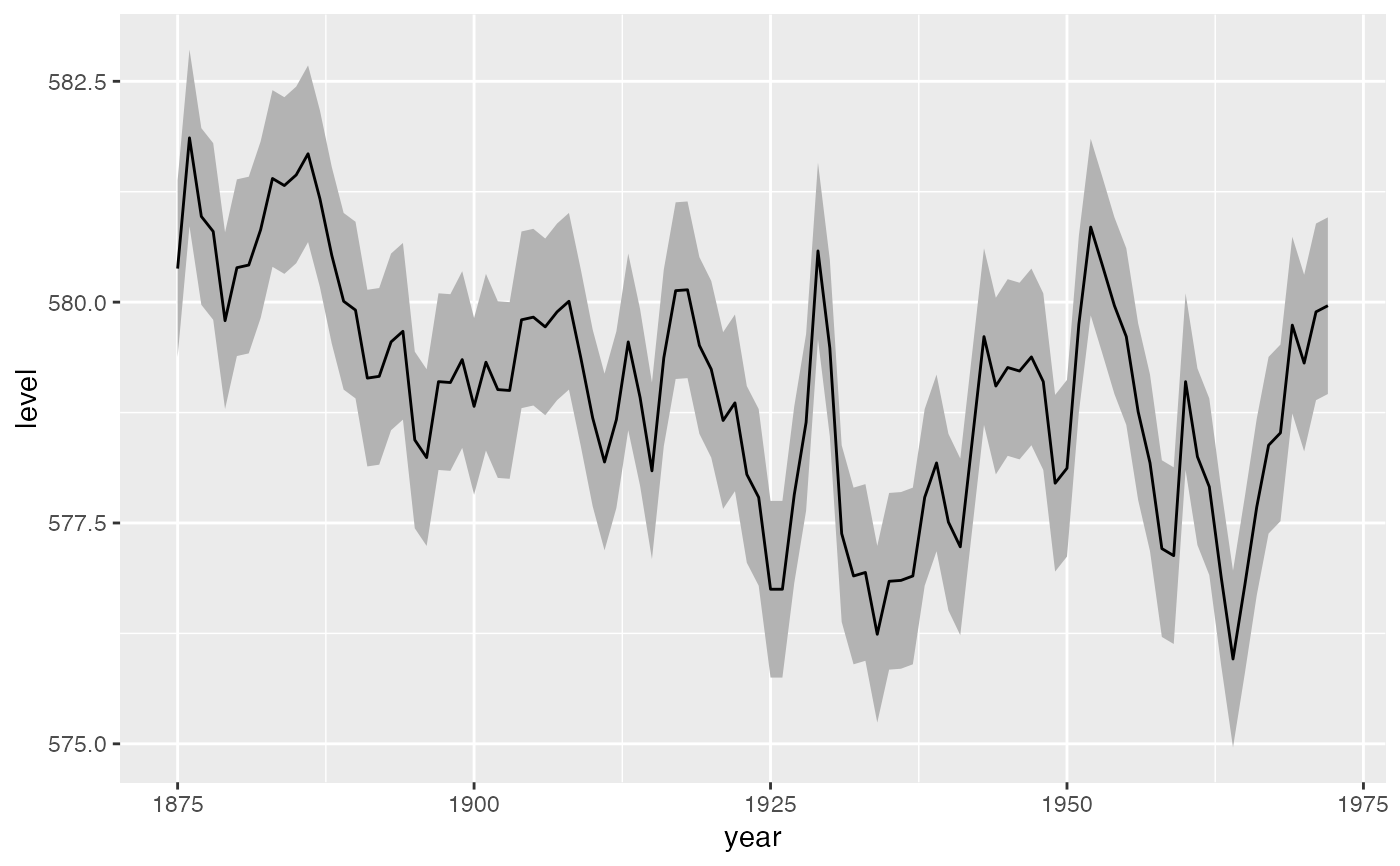
Examples
library(ggplot2) huron <- data.frame(year = 1875:1972, level = as.vector(LakeHuron)) h <- ggplot(huron, aes(year)) h + geom_stepribbon(aes(ymin = level - 1, ymax = level + 1), fill = "grey70") + geom_step(aes(y = level))h + geom_ribbon(aes(ymin = level - 1, ymax = level + 1), fill = "grey70") + geom_line(aes(y = level))