Comparison with fippy (Python Implementation)
Cross-language validation of feature importance methods
Source:vignettes/articles/fippy-comparison.Rmd
fippy-comparison.Rmd
library(data.table)
library(ggplot2)
library(jsonlite)
library(knitr)
library(glue)
library(here)

# Set seed for reproducibility
set.seed(123)
Overview
This article compares xplainfi’s feature importance implementations with those from fippy, a Python package implementing similar methods. This comparison serves as a regression test to ensure methodological consistency across language implementations.
The comparison includes:
- PFI (Permutation Feature Importance)
- CFI (Conditional Feature Importance)
- RFI (Relative Feature Importance)
- SAGE (Shapley Additive Global Importance) - both marginal and conditional variants
Methodology
Both implementations use:
-
Dataset: Ewald et al. simulation with 5000
observations (
sim_dgp_ewald()) - Evaluation: Same train/test data (70% train)
- Metrics: Mean Squared Error for importance calculations
The Ewald simulation provides an interpretable test case where we can better understand expected feature importance patterns, particularly for conditional methods that account for feature dependencies.
Due to the difference in underlying conditional samplers (ARF for xplainfi vs Gaussian samplers in fippy) we expect conditional methods to show more variation than marginal ones.
Setup and Execution
The comparison uses separate calculation scripts:
# 1. Calculate xplainfi results
cd vignettes/articles/fippy-comparison
Rscript calculate_xplainfi.R

# 2. Calculate fippy results (portable with uv - automatically installs dependencies)
./calculate_fippy.py
Both scripts generate JSON files with results that are loaded below for comparison.
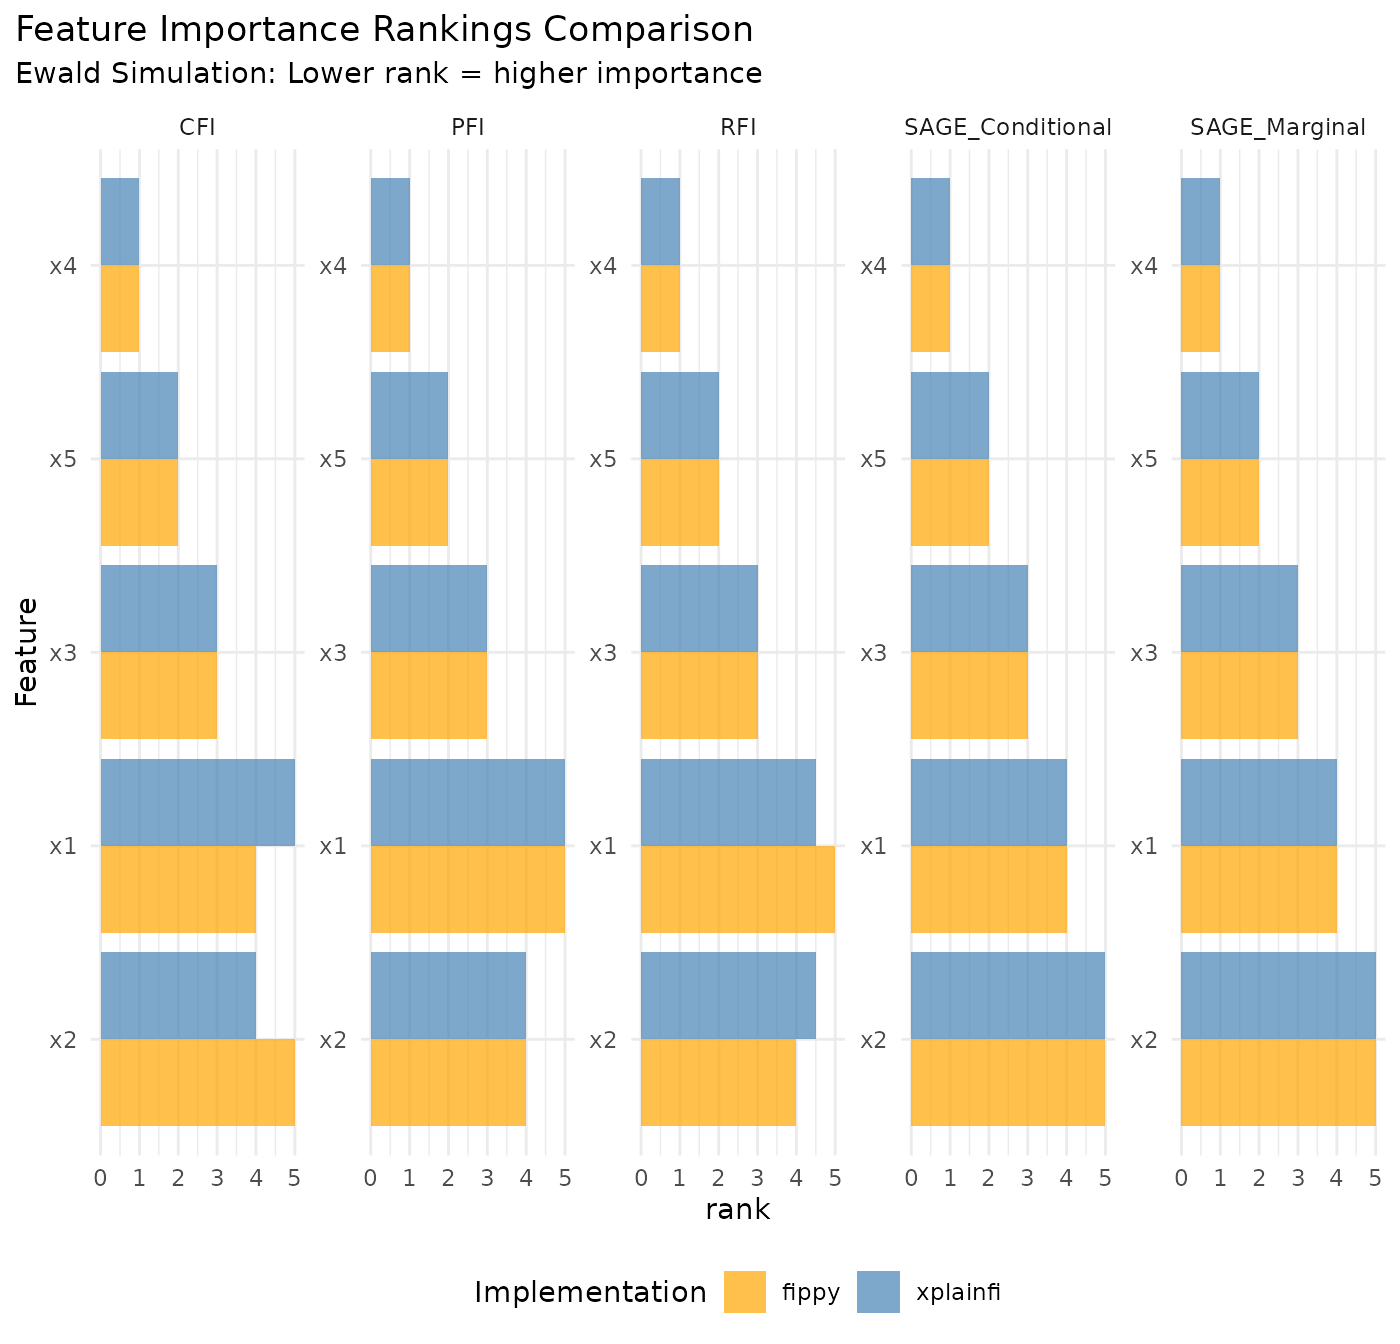
Expected Feature Importance Patterns
The Ewald simulation (sim_dgp_ewald) generates a
regression task with 5 features (x1-x5) where:
- All features contribute to the target variable, but with different weights
- Some features are correlated, making conditional methods particularly interesting
- The known data generating process allows us to validate whether the methods identify sensible patterns
Load Results
# Check that both result files exist
# Look in the fippy-comparison subdirectory
base_dir <- here::here("vignettes", "articles", "fippy-comparison")
xplainfi_results_path <- file.path(base_dir, "xplainfi_results.json")
fippy_results_path <- file.path(base_dir, "fippy_results.json")

if (!file.exists(xplainfi_results_path)) {
    stop("xplainfi_results.json not found. Please run calculate_xplainfi.R first.")
}

if (!file.exists(fippy_results_path)) {
    stop("fippy_results.json not found. Please run calculate_fippy.py first.")
}

# Load results from both implementations
xplainfi_results <- fromJSON(xplainfi_results_path)
fippy_results <- fromJSON(fippy_results_path)
Model Performance Comparison
performance_comparison <- data.table(
    Implementation = c("xplainfi (R)", "fippy (Python)"),
    R_squared = c(
        round(xplainfi_results$model_performance$r_squared, 4),
        round(fippy_results$model_performance$r_squared, 4)
    )
)

kable(performance_comparison, caption = "Model Performance Comparison")| Implementation | R_squared |
|---|---|
| xplainfi (R) | 0.8403 |
| fippy (Python) | 0.8376 |
Method Comparisons
compare_method <- function(method_name, xplainfi_result, fippy_result) {
    # Both implementations available
    method_dt <- data.table(
        feature = xplainfi_result$feature,
        xplainfi = xplainfi_result$importance,
        fippy = fippy_result$importance
    )

    # Return table and correlation for display
    correlation <- cor(method_dt$xplainfi, method_dt$fippy)
    correlation_spearman = cor(method_dt$xplainfi, method_dt$fippy, method = "spearman")

    list(
        method = method_name,
        table = kable(
            method_dt[order(-xplainfi)],
            caption = glue("{method_name} Results Comparison"),
            digits = 4
        ),
        correlation = correlation,
        correlation_spearman = correlation_spearman
    )
}
PFI (Permutation Feature Importance)
pfi_result <- compare_method("PFI", xplainfi_results$PFI, fippy_results$PFI)
pfi_result$table| feature | xplainfi | fippy |
|---|---|---|
| x4 | 0.7115 | 0.7892 |
| x5 | 0.3816 | 0.4809 |
| x3 | 0.0115 | 0.0030 |
| x1 | -0.0005 | 0.0006 |
| x2 | -0.0006 | 0.0020 |
CFI (Conditional Feature Importance)
cfi_result <- compare_method("CFI", xplainfi_results$CFI, fippy_results$CFI)
cfi_result$table| feature | xplainfi | fippy |
|---|---|---|
| x4 | 0.4344 | 0.4706 |
| x5 | 0.3616 | 0.4491 |
| x3 | 0.0017 | 0.0013 |
| x2 | 0.0004 | -0.0007 |
| x1 | -0.0003 | 0.0011 |
RFI (Relative Feature Importance)
rfi_result <- compare_method("RFI", xplainfi_results$RFI, fippy_results$RFI)
rfi_result$table| feature | xplainfi | fippy |
|---|---|---|
| x4 | 0.4310 | 0.6920 |
| x5 | 0.3630 | 0.2546 |
| x2 | 0.0000 | 0.0002 |
| x3 | 0.0000 | 0.0018 |
| x1 | -0.0006 | 0.0000 |
glue("xplainfi conditioning set: {paste(xplainfi_results$RFI$conditioning_set, collapse = ', ')}")## xplainfi conditioning set: x1, x2
glue("fippy conditioning set: {paste(fippy_results$RFI$conditioning_set, collapse = ', ')}")## fippy conditioning set: x1, x2SAGE Methods
Marginal SAGE
sage_marginal_result <- compare_method(
    "Marginal SAGE",
    xplainfi_results$SAGE_Marginal,
    fippy_results$SAGE_Marginal
)
sage_marginal_result$table| feature | xplainfi | fippy |
|---|---|---|
| x4 | 0.3745 | 0.4695 |
| x5 | 0.1749 | 0.3759 |
| x3 | 0.0198 | 0.0147 |
| x1 | 0.0000 | 0.0021 |
| x2 | -0.0002 | -0.0131 |
Conditional SAGE
sage_conditional_result <- compare_method(
    "Conditional SAGE",
    xplainfi_results$SAGE_Conditional,
    fippy_results$SAGE_Conditional
)
sage_conditional_result$table| feature | xplainfi | fippy |
|---|---|---|
| x4 | 0.4482 | 0.3661 |
| x5 | 0.2766 | 0.3567 |
| x3 | 0.0557 | 0.0907 |
| x1 | -0.0758 | 0.0002 |
| x2 | -0.0841 | -0.0273 |
Correlation Summary
correlations <- rbindlist(list(
    pfi_result[c("method", "correlation", "correlation_spearman")],
    cfi_result[c("method", "correlation", "correlation_spearman")],
    rfi_result[c("method", "correlation", "correlation_spearman")],
    sage_marginal_result[c("method", "correlation", "correlation_spearman")],
    sage_conditional_result[c("method", "correlation", "correlation_spearman")]
))

kable(
    correlations,
    digits = 4,
    caption = "Pearson and Spearman Correlations between xplainfi and fippy",
    col.names = c("Method", "Pearson Corr.", "Spearman Corr.")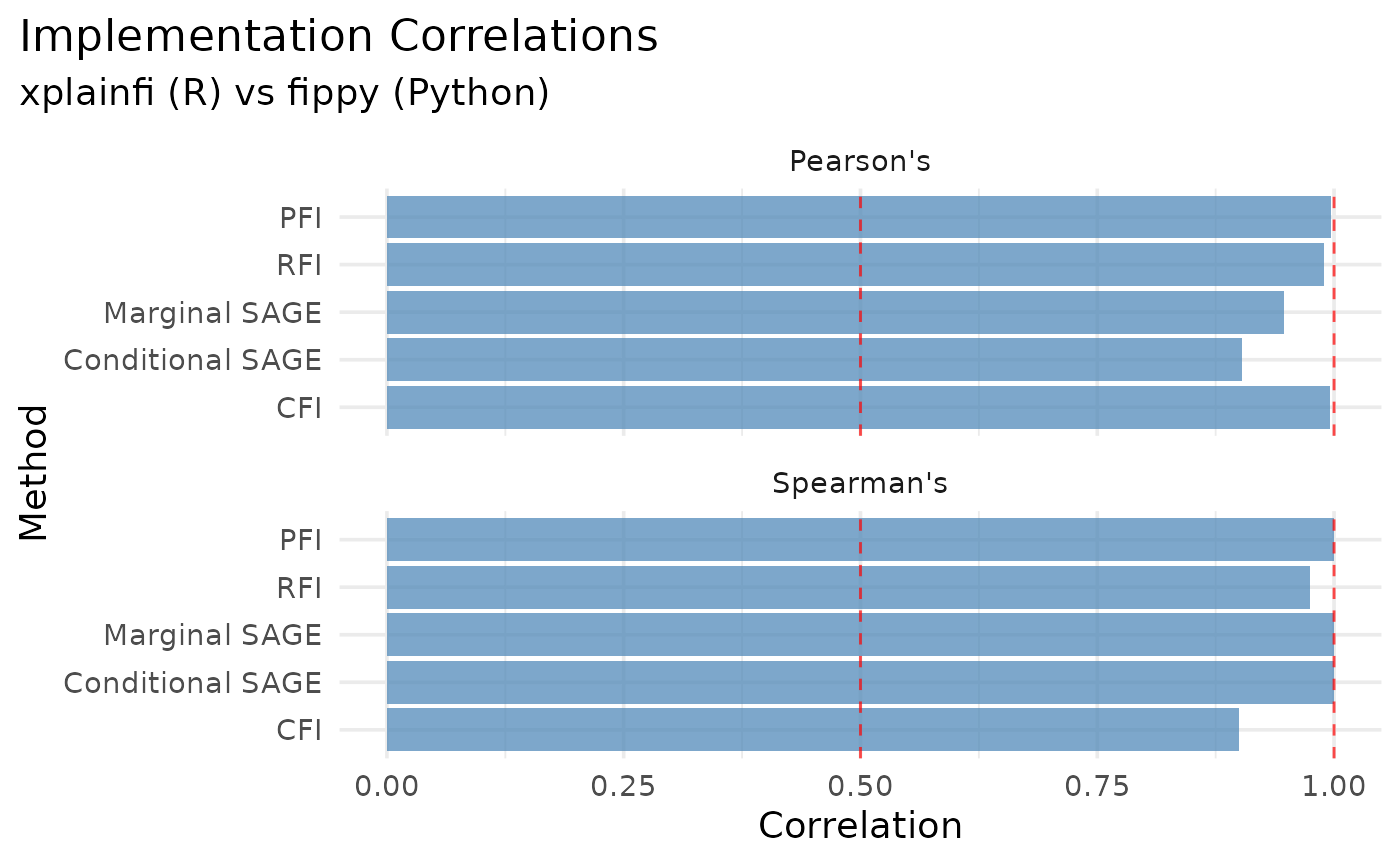
)| Method | Pearson Corr. | Spearman Corr. |
|---|---|---|
| PFI | 0.9975 | 0.9000 |
| CFI | 0.9962 | 0.9000 |
| RFI | 0.9096 | 0.9747 |
| Marginal SAGE | 0.9534 | 1.0000 |
| Conditional SAGE | 0.9688 | 1.0000 |
melt(correlations, id.vars = "method") |>
    ggplot(aes(x = reorder(method, value), y = value)) +
    facet_wrap(
        vars(variable),
        ncol = 1,
        labeller = as_labeller(c(correlation = "Pearson's", correlation_spearman = "Spearman's"))
    ) +
    geom_col(fill = "steelblue", alpha = 0.7) +
    geom_hline(yintercept = c(0.5, 1), linetype = "dashed", color = "red", alpha = 0.7) +
    coord_flip() +
    labs(
        title = "Implementation Correlations",
        subtitle = "xplainfi (R) vs fippy (Python)",
        x = "Method",
        y = "Correlation"
    ) +
    theme_minimal(base_size = 14) +
    theme(
        plot.title.position = "plot"
    )
Interpretation in Context of Ewald Simulation
The Ewald simulation provides interpretable feature importance patterns that help validate both implementations:
Method-Specific Insights
Marginal vs Conditional Methods:
- PFI and Marginal SAGE ignore feature correlations
- CFI, RFI, and Conditional SAGE account for feature dependencies
- Differences between marginal and conditional variants reveal the impact of feature correlations
RFI Conditioning: Both implementations use
{x3} as the conditioning set.
Cross-Implementation Consistency: High correlations indicate that both xplainfi and fippy identify similar underlying feature importance patterns despite using different:
- Programming languages (R vs Python)
- Conditional sampling approaches (ARF vs Gaussian)
- Implementation details